Skip to content
Home
Helium
What is a Helium Hotspot?
How to Install a Helium Hotspot
Helium Maps and Elevation Measuring
Helium Hotspot Cables and Connections
Port Forwarding – Helium Miner
Things to Consider when installing a Helium Miner
Helium Hotspot Antenna Gallery
Best Stablecoin Investing Websites
Crypto Blog
HotspotRF Referral code 2022
PHP
Php – Arrays
Php – Csv
Php – Dates & Time
Php – Email
Php – Loops
Php – Maths
Php – Miscellaneous
Php – Strings
Jquery
Jquery – Ajax
Jquery – Forms Posting
Jquery – Modals
Jquery – Strings
Jquery – Tricks
Jquery – Validation
Jquery – Variables
Jquery – Misc
MySQL
CSS
Javascript
WordPress
Admin – WP
WooCommerce
WordPress – Get
WordPress – Miscellaneous
WordPress – Show
Misc
Firefox
Python
Random Coding
Raspberry Pi
Reviews
SEO
SEO News
Sublime Text
Windows
[wd_asp elements=’search’ ratio=’100%’ id=1]
Jquery Misc
Accordion – Simple basic
Animate method
Append content to div
Array loop – echoing each value in Array
Auto Click a button using trigger
Bootstrap CDN
Bootstrap Toggle Switch
Caroufredsel – Headings as links
Carousfredsel lazyload
CDN Tests Jquery library speed loading
CDN’s for all…
Change / Swap CSS by Jquery
Change css with Jquery – OnClick
Change div text contents
Change form action depending on dropdown
Change function of button onclick
Changing/hiding frame sizes using Jquery
Check if hidden / visible – Visibility
Click on dynamically created elements
Click() method
Clone div and increase id number – Jquery
Create a Jquery function
Data attribute – Hiding & Showing
Datatables
Datepicker settings
die() – but in jquery – javascript
Disable/Enable a Button Using Jquery and CSS
Drag and Drop & Update Database
Draggable and Droppable Jquery Basic
Dropdown set by Jquery
Dropdowns – Bootstrap style
Dropdowns – Bootstrap style on hover
Each function – Jquery change text of div – instantly
Elementor Mobile Menu not closing using anchors on a one pager SOLVED
Exclude from array using Jquery – Not in
Fade images in a function
Flip switch jquery mobile
Get difference between 2 dates in days- Datepicker
Get value of text box using Jquery Find not Closest
Hide an Iframe
Hide element with dropdown
Hide/disable all buttons jquery
Hide/Show a Div with button click
Highcharts line graph
How to print only a Div – Forget print media css
HTML table to CSV using jquery
IE only jquery
If Contains Class
Image upload with preview
Jquery – Hide – Show – Fade – Slide
jQuery Event Methods
Jquery index – Show content with same index
jQuery Mobile Demos
Live() function
Load data into a div using .load
Load results from database into div append -easing
mouseleave – mouseenter
Move a div or element – animate
NoConflict – Jquery Errors
Open specific tab when page is load – Jquery Tabs
Overwrite/empty text/html in Div (.html)
Placeholder script for IE
Puff – Slide, Jquery effects
Refresh the query inside a div
Run code only once .one()
Run Mysql Search From Jquery
Script for dynamically adding text boxes
Select all checkboxes at once
Set Scrollbar position to top – reset textearea
Show event triggets method – event.type
Show what child index of an element
Thumbnail Gallery Fullscreen image on Click
transfer – cart – shopping trolley add jquery effect
Two ids or classes in a Jquery function
Two stylish buttons calling ajax post
Waypoints scrolling lazy load
Hicharts dynamic data from database
20th September 2016
Jquery Misc
Firefox 137 Toolbars – Tabs on Bottom – Updated April 2025
Firefox 133 Toolbars – Tabs on Bottom – Update Nov 24
Exclude category from blog while adding them to sitemap.xml
What Router can I use with Onestream Broadband?
Disable buying – Woocommerce
Windows Desktop Wallpaper Background for OCD users with shelves
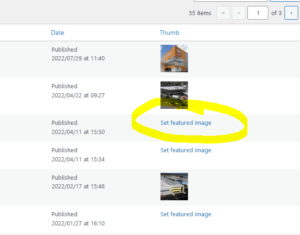
Featured Image Admin Thumb – Working Plugin (WordPress 6.2)
Create a gallery in a Posts page
Clickable elements too close together – Solved
Best ChatGPT Prompts
Make Elementor Accordion Closed by Default
noindex a specific page in WordPress using functions file
A random number picker that picks 6 numbers from 1 to 49 but only once
Sticky header – Logo smaller and adds border on scroll
Editor Only CSS – Elementor Sticky Header
Change Woocommerce Dropdowns to Radio Buttons
Get character count of a string saved in database – html_entity_decode not working
How to check if a checkbox has been ticked in Jquery
Slash canonicalization at the end of the URL – htaccess
Elementor json template files not uploading
Multiple featured images for blog posts
Autostart Browser in Kiosk Mode – Raspberry Pi 4 Terminal Command
Open Chromium full screen -Raspberry Pi (Kiosk mode)
Populate dropdown with data from database